Data and analytics for water
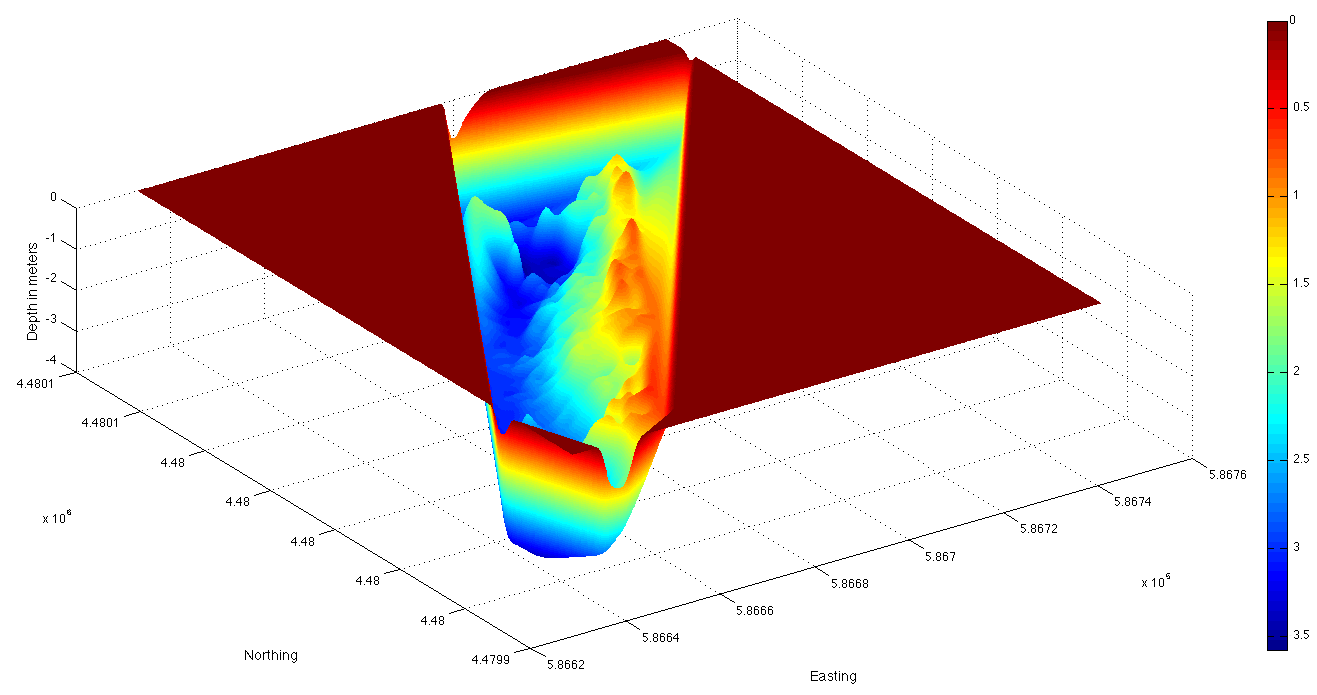
Bathymetry
Knowing how much water you have and the topography of the bottom is a critical first step in managing any water body. Platypus will come out to your site, with one or more robots, and quickly get you maps of the water.
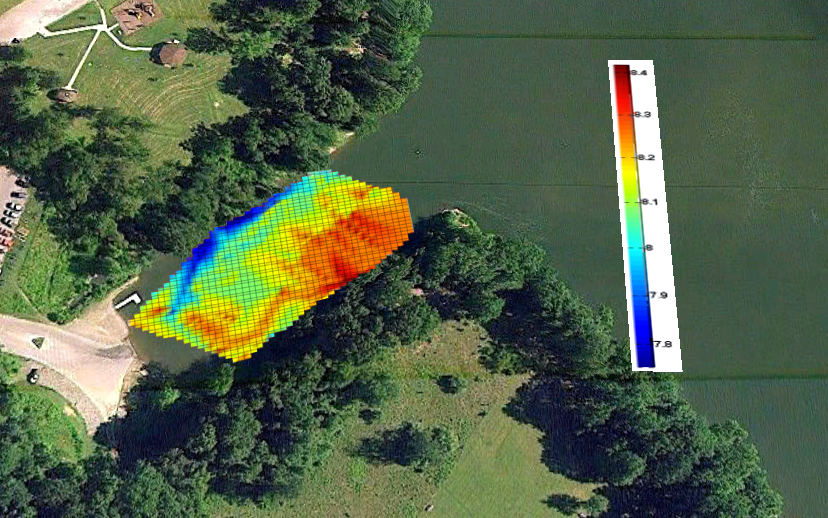
Water quality
Measuring water quality parameters is critical to managing healthy water. However, knowing a parameter at a single location at a single point in time, doesn't give the whole picture. Platypus robots make spatially dense maps of critical water quality parameters, giving you a full understanding of what is going on in a water body. Understanding mixing patterns, dispersion and variation makes management of any water more efficient.
See here for a case study in The Netherlands
Profiling
Water stratifies and knowing what is going on under the surface is important for managing the environment. From salinity stratification to oxygen stratification, what you can measure at the surface is only a small part of the story. Platypus robots will lower sensors down to 30' to understand the whole water column, not just the top.
Data and analytics for Land
Ground penetrating radar
Ground penetrating radar (GPR) is a geophysical method that uses radar pulses to image the subsurface. This non-destructive method uses electromagnetic radiation in the microwave band (UHF / VHF frequencies) of the radio spectrum and detects reflected signals from subsurface structures. GPR can have applications in a variety of media, including rock, soil, ice, fresh water, pavements, and structures. Under the right conditions, professionals can use GPR to detect subsurface objects, changes in material properties, and voids and cracks.
Data and analytics from the Air
Multi and Hyper spectral imagery
Multispectral cameras work by imaging different wavelengths of light. Once processed, the output of the camera data is a set of images where the value of each pixel is equal to percent reflectance of light for that particular wavelength. These sets of images are then stitched together to create geographically accurate mosaics, with multiple layers for each wavelength. Mathematically combining these layers yields vegetation indices. There are many types of vegetation indices that measure different characteristics of a plant such as chlorophyll content of plant leaves, nitrogen content or water stress. Other indices can be used to estimate nitrogen content. (Learn more.)