
Managing Dutch Water ways
Dutch water boards are regional government bodies charged with managing water barriers, waterways, water levels, water quality and sewage treatment in their respective regions. These regional water authorities are among the oldest forms of local government in the Netherlands, some of them having been founded in the 13th century. There are 23 water boards
A critical challenge
Around 26 percent of the area of the Netherlands is at or below sea level. Historically there always was a good deal of coastal and river flooding. Flood control in the Netherlands is a national priority, since about two thirds of the country is vulnerable to flooding, while at the same time it is one of the most densely populated areas on Earth.
“Platypus adds value in the sense that it provides and almost instant snapshot of greenhouse areas water quality. In a relatively short period and with little manpower, it gives us a good understanding of the most suspicious water bodies, providing the basis for a constructive discussion with the greenhouse growers in these areas to identify and terminate nutrient and pesticide emissions into the water. ”

Delfland
The Hoogheemraadschap van Delfland water authority manages an area of intensive greenhouse agriculture, through which approximately 15km of small canals run, providing water. The water authority is very interested in managing the quality of the water, for both efficiency and environmental reasons. The water authority is highly sophisticated and has high quality information about the water coming into the area and the water existing the area. Any of the greenhouses may be contributing more runoff fertilizer and pesticides than others. Identifying problem greenhouses would allow the water authority to improve the water quality and help reduce fertilizer inputs. However, with such a large distance of canal, it is infeasible to measure all the water by hand, making identifying problem greenhouses very difficult.
Lutras on the case
Platypus deployed a technician and a Lutra robot boat to measure the water quality. The boat was equipped with sensors for temperature, pH, electrical conductivity and dissolved oxygen. The robot was calibrated each morning and taken from canal to canal. While the canals were nominally connected, it wasn’t always possible for the robots to navigate, because of gates, weeds or other issues. At each location, the robot was sat in the water for 1-3 minutes for the sensors to settle before navigating the boats at 2-4km/h.

Electrical conductivity readings over the area

Detailed view of electrical conductivity in a small area
10km of the canals were traversed for data collection, with the rest not traversable. The data collection was repeated two months later. The first data collection took about 2.5 days and the second only 2 days, dramatically less than any hand sampling process.
The above graphs show a small sample of the data provided to the water authority. Below are histograms showing the variance in the region and how the water varied slightly from day to day.
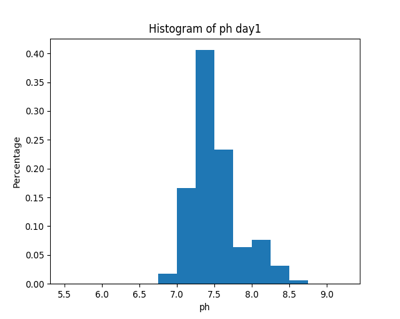
Distribution of pH on the first day of data collection

Distribution of pH on the second day of data collection
Outcomes
Based on the data collected, the water authority was able to identify two greenhouses with leaks and find relatively low-cost fixes to improve efficiency and water quality. In one case, a detected anomaly could not be matched with a greenhouse problem.
Going forward, Platypus will be integrating the repeated data collections at the site into its analytics model, Aquatical Analytics™ that will predict water issues and changes over time, as well as target individual sensor readings to best monitor the whole area.